Cortex XQL Dashboard Queries Library - Posture, Attack Path & Asset Analysis
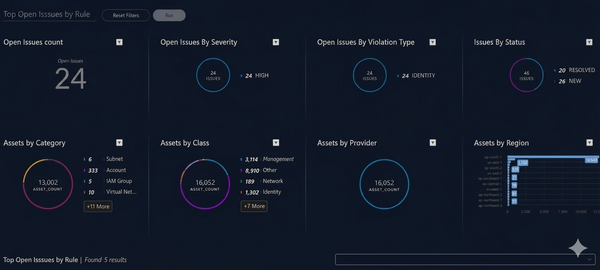
Build professional security dashboards with these essential XQL queries for monitoring Posture, Attack Paths, and Asset Inventory.
A high-performance security dashboard is the heart of a Security Operations Center (SOC). In Cortex XDR/XPro, the power of dashboards comes from XQL (XDR Query Language).
In this guide, we will break down eight essential queries for monitoring Security Posture, Attack Path detections, and Asset Inventory. These queries are specifically designed for dashboard widgets, using the comp and view stages to create impactful visualizations.
1. Key Performance Indicator: Total Open Issues
This query creates a "Single Value" widget that displays the total number of critical open issues. It's the first thing an analyst should see.
The Query:
dataset=issues
| filter (xdm.issue.domain = "POSTURE" or xdm.issue.detection.method = "ATTACK_PATH")
  and (xdm.issue.status.progress = "NEW" or xdm.issue.status.progress = "UNDER_INVESTIGATION")
  and xdm.issue.external_id contains to_string($y_axis.value)
| fields xdm.issue.id as issue_id
| comp count(issue_id) as issues
| view graph type = single subtype = grouped header = "Open Issues" xaxis = xdm.issue.status.progress yaxis = issues headerfontsize = 14
Detailed Explanation:
dataset=issues: We target the issues dataset, which contains security findings from posture scans and attack path analysis.- Filtering Logic:
- We narrow down the scope to
POSTUREorATTACK_PATHdomains. - We focus only on active work by filtering for
NEWorUNDER_INVESTIGATIONstatuses. $y_axis.value: This is a dynamic parameter, allowing the dashboard to filter based on interactions with other widgets.
- We narrow down the scope to
- Aggregation:
comp count(issue_id)calculates the numeric total. - Visualization:
view graph type = singlerenders this as a large, readable number—perfect for high-level summaries.
2. Risk Distribution: Open Issues by Severity
Not all issues are created equal. This query categorizes your open workload by severity levels (Critical, High, Medium, Low) using a Pie Chart.
The Query:
dataset=issues
| filter (xdm.issue.domain = "POSTURE" or xdm.issue.detection.method = "ATTACK_PATH")
  and (xdm.issue.status.progress = "NEW" or xdm.issue.status.progress = "UNDER_INVESTIGATION")
  and xdm.issue.external_id contains to_string($y_axis.value)
| fields xdm.issue.id as issue_id, xdm.issue.severity as severity
| comp count(issue_id ) as issues by severity
| view graph type = pie subtype = grouped xaxis = severity yaxis = issues headerfontsize = 14
Detailed Explanation:
- Field Selection: We explicitly bring in
xdm.issue.severityto use it for grouping. - Grouping:
comp ... by severitytells Cortex to create a bucket for every severity level found in the filtered records. - Visualization: A
piechart provides an immediate visual of whether your environment is dominated by critical risks or low-level maintenance tasks.
3. Structural Analysis: Issues by Category
Understanding the type of security gaps is crucial for remediation. Is it an IAM issue? A network misconfiguration? This query breaks it down.
The Query:
dataset=issues
| filter (xdm.issue.domain = "POSTURE" or xdm.issue.detection.method = "ATTACK_PATH")
  and (xdm.issue.status.progress = "NEW" or xdm.issue.status.progress = "UNDER_INVESTIGATION")
  and xdm.issue.external_id contains to_string($y_axis.value)
| fields xdm.issue.id as issue_id, xdm.issue.category as category
| comp count(issue_id ) as issues by category
| view graph type = pie subtype = grouped xaxis = category yaxis = issues headerfontsize = 14
Detailed Explanation:
xdm.issue.category: This field identifies the security domain of the issue (e.g., Storage, Identity, Networking).- Impact: By visualizing this, SOC managers can assign remediation tasks to specific teams (e.g., the Cloud Infra team vs. the Identity team).
4. Lifecycle Tracking: Issue Progress Status
Finally, it's important to see the overall health of your issue management process. This query shows how many issues are in each stage of the lifecycle.
The Query:
dataset = issues
| filter xdm.issue.external_id contains to_string($y_axis.value)
  and xdm.issue.domain = "POSTURE" or xdm.issue.detection.method = "ATTACK_PATH"
| fields xdm.issue.id as issue_id, xdm.issue.status.progress as progress
| comp count(issue_id ) as issues by progress
| view graph type = pie subtype = grouped xaxis = progress yaxis = issues headerfontsize = 14
Detailed Explanation:
- Shift in Scope: Unlike the previous queries, this one removes the status filter. This allows us to see
RESOLVED,CLOSED, andDISMISSEDissues alongside the open ones. - Business Value: This widget serves as a progress tracker, showing the ratio of resolved issues vs. pending ones over time.
5. Cloud Presence: Assets by Region
This query provides a geographic overview of your cloud footprint, grouping assets by their assigned cloud region.
The Query:
dataset = asset_inventory
| filter xdm.asset.realm contains to_string($y_axis.value) and xdm.asset.cloud.region != null
| comp count() as asset_count by xdm.asset.cloud.region
| sort desc asset_count
| view graph type = column subtype = grouped layout = horizontal show_callouts = `true` xaxis = xdm.asset.cloud.region yaxis = asset_count default_limit = `false` headerfontsize = 14 legend = `false`
Detailed Explanation:
dataset = asset_inventory: Switches focus to the asset management data.xdm.asset.cloud.region != null: Ensures we only visualize assets where geographic data is available.comp count() ... by xdm.asset.cloud.region: Aggregates the number of assets per region.view graph type = column: Renders a horizontal column chart, ideal for comparing population sizes across regions.
6. Vendor Distribution: Assets by Provider
Understanding your multi-cloud concentration is key for risk management. this query breaks down assets by provider (AWS, Azure, GCP, etc.).
The Query:
dataset = asset_inventory
| filter xdm.asset.realm contains to_string($y_axis.value) and xdm.asset.provider != null
| comp count() as asset_count by xdm.asset.provider
| view graph type = pie show_callouts_names = `true` show_percentage = `false` xaxis = xdm.asset.provider yaxis = asset_count default_limit = `false` font = "Arial" headerfontsize = 14 legend = `false` legend_percentage = `true`
Detailed Explanation:
xdm.asset.provider: Identifies the underlying cloud or infrastructure provider.legend_percentage = true: Enhances the pie chart by showing what fraction of your total inventory belongs to each provider.
7. Logical Grouping: Assets by Class
Assets are often logically divided into classes (e.g., Computer, Storage, Network). this widget provides a high-level view of these classes.
The Query:
dataset = asset_inventory
| filter xdm.asset.realm contains to_string($y_axis.value) and xdm.asset.type.class != null
| comp count() as asset_count by xdm.asset.type.class
| view graph type = pie subtype = grouped xaxis = xdm.asset.type.class yaxis = asset_count headerfontsize = 14
Detailed Explanation:
xdm.asset.type.class: Provides a primary classification of the asset type.- Impact: Helps security admins verify if the ratio of compute to storage assets matches organizational expectations.
8. Categorical View: Assets by Category
For a more granular look, this query breaks down assets by their specific category, offering deeper insights than simple class-based grouping.
The Query:
dataset = asset_inventory
| filter xdm.asset.realm contains to_string($y_axis.value) and xdm.asset.type.category != null
| comp count() as asset_count by xdm.asset.type.category
| view graph type = pie subtype = grouped xaxis = xdm.asset.type.category yaxis = asset_count headerfontsize = 14
Detailed Explanation:
xdm.asset.type.category: Drill down into specific categories (e.g., Virtual Machine, Load Balancer, S3 Bucket).- Visualization: A grouped pie chart makes it easy to see which specific service categories are most prevalent in your environment.
Pro Tip for Dashboards
When using these queries in Cortex, ensure you set the Time Range to "Last 7 Days" or "Last 30 Days" in the widget settings. Posture issues can accumulate, and keeping a tight time window helps you focus on recent regressions!
Summary Table for Quick Reference
| Widget Goal | Chart Type | Key Field |
|---|---|---|
| Total Workload | Single Value | count(issue_id) |
| Priority View | Pie Chart | severity |
| Team Assignment | Pie Chart | category |
| Process Health | Pie Chart | status.progress |
| Regional Spread | Column Chart | cloud.region |
| Multi-Cloud View | Pie Chart | provider |
| Asset Class | Pie Chart | type.class |
| Asset Category | Pie Chart | type.category |
Happy Hunting!